Your solar panels could be saving you hundreds each year; but only if they’re performing as expected. The problem is, most homeowners see numbers in their solar app without really knowing what they mean.
According to the Energy Saving Trust, a typical UK household can save £180–£440 annually with solar panels, but that depends heavily on how efficiently your system is working and how you use it.
Those numbers on your dashboard aren’t just data; they tell you whether you’re saving money or missing out.
This guide will help you understand what your solar readings actually mean and how to use them to your advantage.
The 5 Solar Numbers That Actually Matter
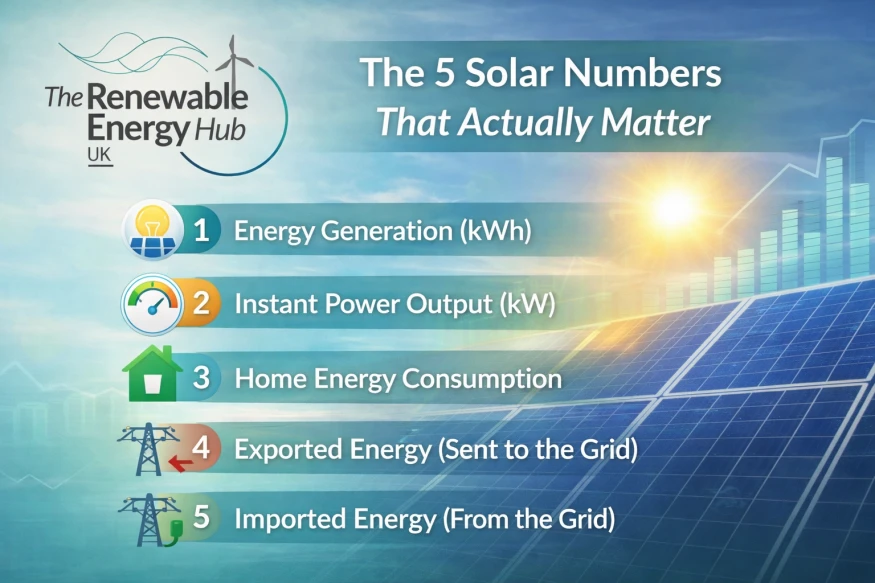
To make sense of your solar data, you need to focus on a few key numbers. These metrics form the foundation of how your system performs and how your energy is used.
1. Energy Generation (kWh)
This is the total amount of electricity your solar panels produce over a period of time: daily, monthly, or annually. For example, if your system generates 15 kWh in a day, that’s the total energy available for your home or export.
What this means for you:
- Higher generation usually indicates strong performance
- Seasonal changes will naturally affect this number
- It acts as the baseline for understanding savings
2. Instant Power Output (kW)
This metric helps you understand how your system performs in real time throughout the day. It reflects how changing sunlight conditions directly impact your solar output at any given moment.
This shows how much power your system is producing at any specific moment.
You’ll typically notice:
- Lower output in the morning
- Peak output around midday
- Reduced output toward evening
What this means for you:
- Fluctuations are normal and expected
- Zero output during daylight may indicate a problem
3. Home Energy Consumption
This number becomes more valuable when viewed alongside your solar generation. It helps you understand how efficiently your home is using the energy available.
This tells you how much electricity your home is using, regardless of whether it comes from solar or the grid. This number becomes meaningful when compared with generation.
What this means for you:
- If consumption exceeds generation, you’ll rely on the grid
- Aligning usage with solar output improves savings
4. Exported Energy (Sent to the Grid)
Export data shows what happens to the energy your home doesn’t use. It’s a key indicator of whether you’re maximising your solar savings or losing potential value.
This is the excess energy your system produces but doesn’t use within your home.
What this means for you:
- High export often signals unused solar potential
- It may reduce overall savings compared to self-consumption
5. Imported Energy (From the Grid)
Import figures highlight how much you still depend on external electricity. Tracking this helps you identify opportunities to reduce grid usage and improve efficiency.
This is the electricity you draw from your supplier when your solar panels aren’t producing enough.
What this means for you:
- Some import is normal, especially at night
- Lower import usually means better solar utilisation
Quick Summary of Solar Metrics
Here’s a quick overview to help you interpret your solar data at a glance:
|
|
|
|
|
|
|
|
|
|
|
|
|
|
|
|
|
|
|
|
|
|
|
|
Together, these five metrics give you a complete picture, but their real value comes from how they interact in real-world usage.
How to Tell If Your Solar Numbers Are Good or Bad
Understanding individual numbers is only part of the picture. What really matters is how they interact, as this reveals whether your system is performing efficiently or needs attention.
High Generation + High Export
When your system generates a high amount of energy but also exports a large portion, it indicates that your home isn’t using enough of the electricity being produced.
This means a significant portion of your generated energy isn’t being used within your home and is instead sent to the grid.
Low Generation on Sunny Days
If your solar output is low despite clear, sunny conditions, it often points to an underlying issue rather than normal variation.
Common causes include dirt buildup on panels, partial shading from nearby objects, or reduced system efficiency. Persistent low generation in good weather is a clear sign that performance may need to be checked.
High Grid Import Despite Solar
Relying heavily on grid electricity even when you have solar panels usually means your energy usage doesn’t match your generation pattern.
This often happens when most electricity is used in the evening or at night. As a result, you miss the opportunity to use solar power directly and end up with higher electricity costs.
Consistent Daily Production Pattern
A properly functioning solar system follows a predictable daily pattern, with output gradually increasing in the morning, peaking around midday, and declining in the evening.
This consistent curve reflects normal operation and indicates that your system is responding correctly to sunlight conditions without any major disruptions or performance issues.
These patterns help you assess performance, but to interpret them correctly, you need to understand what normal solar output looks like in the UK.
What’s Considered “Normal” Solar Performance in the UK
Solar output naturally changes depending on location, season, and weather conditions. Knowing what’s considered normal in the UK helps you avoid unnecessary concern and better judge your system’s performance.
Seasonal Output Differences
Solar output varies across the year, with higher generation during summer due to longer daylight hours and significantly lower production in winter.
This fluctuation is completely normal in the UK and reflects changing sunlight availability, not a decline in system performance or efficiency.
Weather Impact on Performance
Weather conditions directly affect solar output, with cloud cover, rain, and shorter days reducing generation levels. These temporary drops are expected and should not be mistaken for system issues.
At Renewable Energy Hub, we often see normal weather-related fluctuations misunderstood as performance problems.
Once you know what’s normal, it becomes far more straightforward to identify whether your system is actually functioning as it should.
How to Tell If Your Solar System Is Working Properly
Rather than analysing every detail, a few simple checks can quickly confirm whether your system is operating as expected or showing signs that something may need attention.
What a Healthy Solar System Looks Like
A well-performing solar system shows consistent behaviour that aligns with daylight conditions. It generates electricity from morning through evening, reaches its highest output around midday when sunlight is strongest, and follows a stable daily pattern.
Small fluctuations are normal, but overall consistency across days indicates that your panels and inverter are functioning as expected.
Warning Signs to Watch For
Certain patterns can indicate that your system isn’t performing correctly. A sudden drop in energy production without any weather-related reason, flat or irregular output graphs, or no generation during clear daylight hours are all red flags.
If these issues appear repeatedly rather than occasionally, they usually point to a technical or maintenance-related problem.
When to Ignore vs When to Act
Not every fluctuation in solar output requires action. Temporary dips caused by cloudy weather or minor daily variations are normal and expected.
However, if you notice a consistent drop in performance, output that doesn’t match weather conditions, or issues persisting over several days, it’s a sign that your system should be checked more closely.
After confirming your system is running correctly, the real opportunity lies in using your data to improve efficiency and increase your overall savings.
How to Use Your Solar Data to Save More Money
Your solar data isn’t just for monitoring performance, it can also guide smarter energy use. With a few practical adjustments, you can reduce waste and increase the value of your solar system.
Shift Energy Usage to Daytime
Using electricity during daylight hours allows you to directly consume the energy your system generates, reducing dependence on grid power.
Running appliances like washing machines or dishwashers when solar output is highest ensures that more of your energy needs are met by your panels rather than external supply.
Reduce Energy Export
When a large portion of your generated energy is exported, it means your home isn’t using enough of what your system produces.
Adjusting when you use electricity helps increase self-consumption and improves overall savings
Monitor and Adjust Your Energy Habits
Your daily energy usage patterns directly influence how much benefit you get from solar. By reviewing your monitoring data regularly, you can identify when you rely on grid electricity and adjust your routine to better match solar generation, leading to more efficient usage and improved long-term savings.
To keep your system performing efficiently over time, it helps to follow a simple routine that tracks performance and highlights issues early.
A Simple Weekly Solar Monitoring Routine
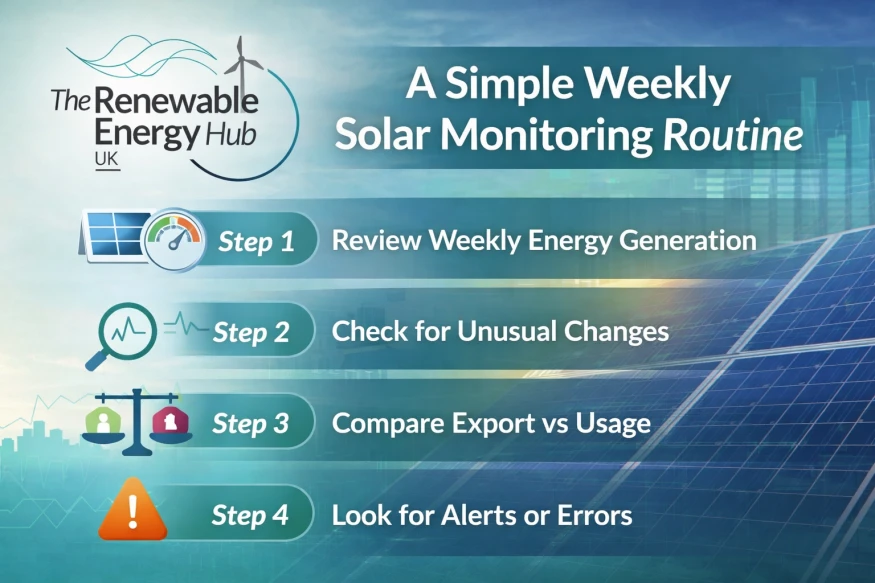
You don’t need to check your system constantly. A simple weekly routine is enough to track performance, spot issues early, and stay confident that everything is working as it should.
Step 1: Review Weekly Energy Generation
Checking your total energy generation each week helps you understand whether your system is performing consistently. Comparing it with previous weeks helps you assess whether your system is maintaining consistent performance over time.
Look for:
- Stable performance across similar weeks
- Gradual seasonal changes (not sudden drops)
- Output that aligns with recent weather conditions
Step 2: Check for Unusual Changes
Sudden variations in output can either be weather-related or indicate a system issue. The key is to compare performance under similar conditions rather than reacting to single-day changes.
Pay attention to:
- Sharp drops without weather changes
- Irregular spikes or inconsistent patterns
- Output that doesn’t match sunlight availability
Step 3: Compare Export vs Usage
Understanding how much energy you use versus how much you export helps measure how efficiently your system is working for you. Higher self-consumption usually leads to better savings.
Ask yourself:
- Am I using most of the energy I generate?
- Is too much energy being exported unnecessarily?
- Can I shift usage to reduce grid dependency?
Step 4: Look for Alerts or Errors
Monitoring systems often provide alerts when something isn’t working properly. Regularly checking these ensures you don’t miss early signs of performance issues.
Check for:
- System or inverter error notifications
- Warnings about reduced performance
- Repeated alerts over multiple days
Following a simple routine like this helps you stay proactive and ensures your system continues performing efficiently over time.
Do You Need a Smart Meter for Solar Monitoring? (Optional)
Solar monitoring systems and smart meters often cause confusion because they track different types of data. Understanding their roles helps you decide whether both are necessary for your setup.
Monitoring vs Smart Meter – Key Difference
Solar monitoring systems and smart meters serve different purposes, even though both deal with energy data. A monitoring system focuses on how your solar panels are performing, showing generation, usage, and system behaviour.
In contrast, a smart meter records how much electricity you import from or export to the grid, mainly for billing and supplier tracking.
When a Smart Meter Is Useful
A smart meter becomes useful when you want accurate measurement of the electricity you export to the grid.
This is particularly important if you are enrolled in export schemes, where payments depend on how much energy you send back. It provides a reliable record for both you and your energy supplier.
When It’s Not Essential
A smart meter isn’t required to understand how your solar system is performing. Your monitoring system already provides detailed insights into generation and system behaviour.
While a smart meter can add value for tracking exports, your core performance data and day-to-day understanding come directly from your solar monitoring setup.
When you understand what your solar numbers are telling you, managing your system becomes simpler, more efficient, and far more rewarding.
Conclusion
The numbers on your solar dashboard aren’t just technical data; they directly determine how much you save and how efficiently your system performs. When you start interpreting them in context, it becomes easier to identify inefficiencies and improve performance.
If you’re not getting the most from your solar system, it’s time to act. Visit Renewable Energy Hub to compare trusted installers and get expert advice that helps you maximise your savings and system performance.